Profit from the AI revolution, with a clear strategy.
Know when to buy, hold or sell ~150 AI and growth names, with exact prices and a nightly alert. Plus a model portfolio, rebuilt monthly by one fixed rule, ahead of holding in 8 of 11 years.
No card required for the free tier. Educational tool, not financial advice.
Worst drop -37% vs -31% holding and -37% Nasdaq. Universe assembled with hindsight, so read the gap, not the level. The numbers
As a portfolio, more return. Per name, shallower drawdowns.
Both tested the same way: rules chosen on earlier data only, then traded forward from 2016 to 2026, after costs.
Worst drop -37% versus -31% holding and -37% for the Nasdaq 100; Sharpe 1.21 versus 1.20 and 0.84.
Top 20 of the quality names the engine is long, ranked by 12-month momentum at each month-end, engine-sized, no leverage, after costs. It beat holding the same names in 8 of 11 years.
The honest caveat · read the gap, not the level
The universe was assembled knowing which names won, so the level is inflated for the strategy and the benchmark alike. On a broad set of 445 US stocks that were never selected for anything, the same rule did +43.2% against +21.3% holding; on sector ETFs, with no survivorship at all, it earns the few points a year the academic literature reports, at equal Sharpe and higher volatility. The same code builds the live portfolio and the public track record with past monthly picks; the research note has the full method. Backtested, not live.
The engine gives up return to holding in sharp recovery years. For scale: cash, the S&P 500 and the Nasdaq 100 over the same 2016 to 2026 stretch, dividends included.
Shallower on 128 of the 144 names, a median 5 points of relief, and equal Sharpe. This is the part of the result that holds up.
Backtested, not live · how these numbers are measured
Rolling walk-forward: each January the engine's rules are chosen on data available to that date, then traded for the next calendar year, 2016 to 2026, next-open fills, 5 basis points per unit of turnover, cash earning T-bills. The figures are for the untuned class engines. The per-name tuned rules this site currently ships scored 14.8% a year in the same test, which is why they are under review; the full self-audit and the row-level JSON are public. The static-tail validation this page led with until September 2026 (+22.7% vs +18.9%, −30% vs −57% on 152 names) used rules chosen with that tail in view and remains available as validation JSON. The universe is picked for engine fit, so treat per-name return edges as a curated list; the drawdown discipline holds across essentially every name. Benchmarks cover the same stretch most validation windows span, January 2022 to July 2026: S&P 500 and Nasdaq 100 as total return with dividends (SPY, QQQ), cash as the average 3-month T-bill yield. The row-level artifact and run manifest are public through validation JSON; the separate historical replay applies today’s rules across history and is not live performance.
Every buy. Every sell. On the later validation window.
Pick a name. Triangles are the engine's buys and sells. Below, what $10,000 became versus just holding.
Static-tail validation: later 40%, originally withheld but reused in later research · after costs, next-day execution · backtested, not live · July 2026.
The model portfolio against holding, every year since 2016.
One fixed rule, re-run at every month-end. The years it lost to holding are in the table too.
| Year | Model portfolio | Holding all names | Nasdaq 100 |
|---|---|---|---|
| 2016 | +19.8% | +21.1% | +10.2% |
| 2017 | +37.8% | +35.3% | +32.5% |
| 2018 | +6.7% | +1.6% | -2.7% |
| 2019 | +38.2% | +45.0% | +43.2% |
| 2020 | +69.5% | +49.1% | +47.8% |
| 2021 | +16.8% | +35.5% | +27.2% |
| 2022 | -15.4% | -19.7% | -32.2% |
| 2023 | +54.9% | +43.7% | +52.1% |
| 2024 | +123.7% | +38.4% | +27.5% |
| 2025 | +131.3% | +37.7% | +21.2% |
| 2026 to 08/26 | +50.4% | +22.9% | +14.4% |
| Since 2016, per year | +44.1% | +27.4% | +20.0% |
| Worst drop | -37% | -31% | -37% |
Backtested, not live · how the portfolio is measured
Quality names the class engine is long, ranked by 12-month momentum at the last session of each month; the top 20 held at inverse-volatility weights times the engine's exposure; decisions at a close, fills at the next open, 5 basis points per unit of turnover, cash at T-bills, no leverage. The universe is today's tracked names, assembled knowing which ones won, so equal-weight holding of it beat the Nasdaq 100 by itself; read the gap between the first two columns, not the level. On a broad set of 445 US stocks that were never selected for anything, the same rule did +43.2% against +21.3% holding. The per-name signal's own validation, including its misses, is on the ticker pages and in validation JSON; the research note and the portfolio JSON have the full method and every row.
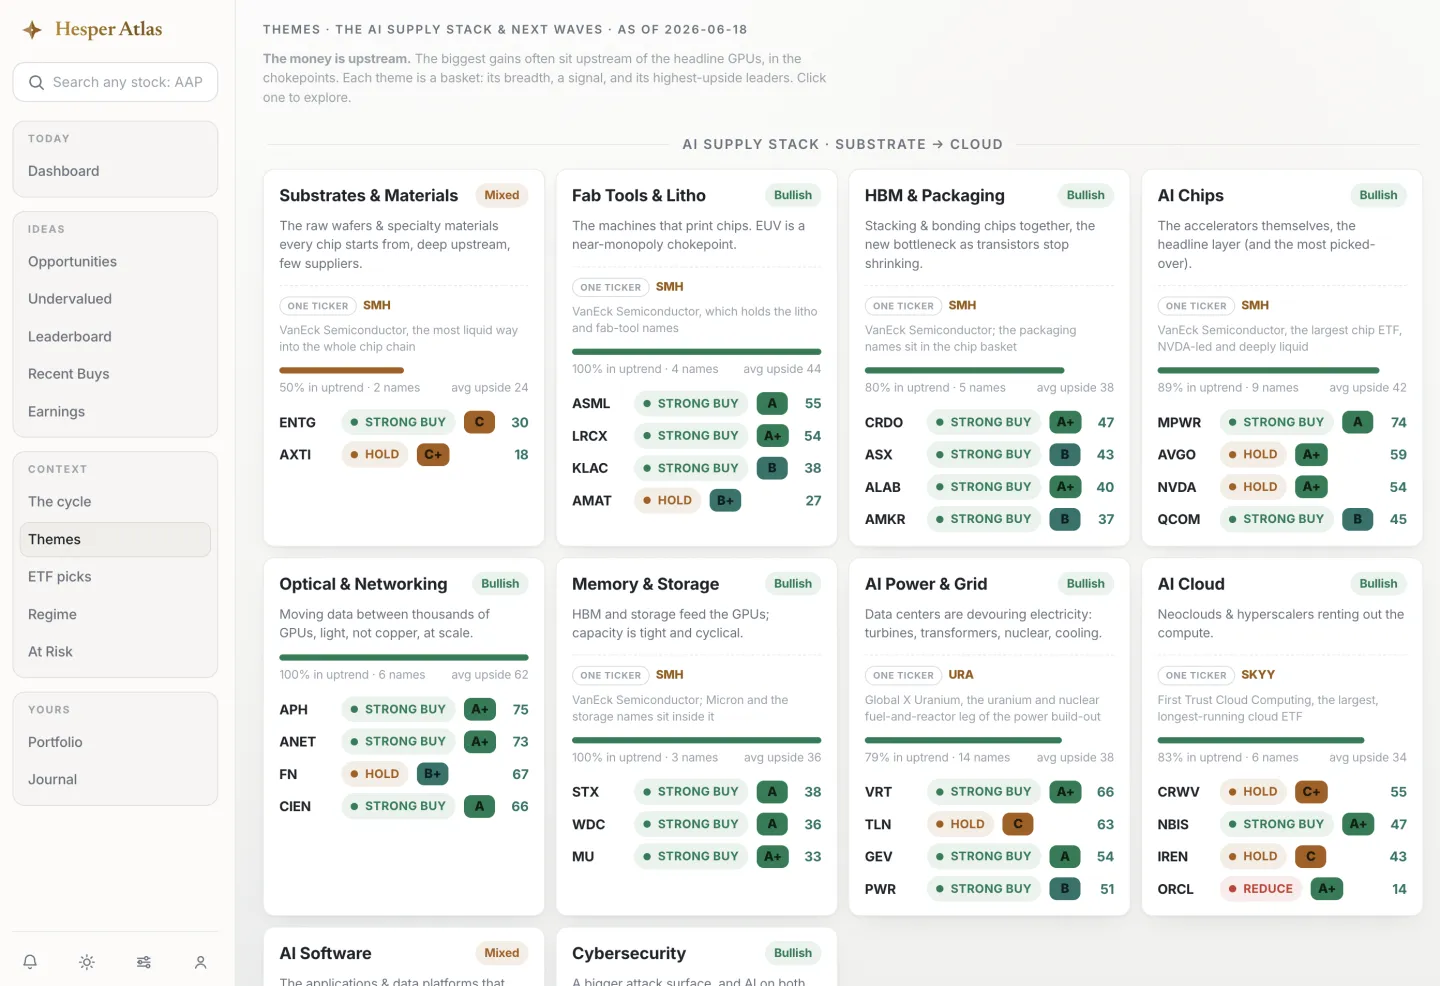
The money is upstream.
The headline GPU names get the attention. The real money sits upstream, in the chokepoints nobody watches.
Plus the adjacent waves: genomics, robotics, quantum, space, fintech. Around 150 names, one nightly signal each.
A second clock: smarter models · the demand side of the build-out
The build-out's demand engine is AI capability itself. The most-cited map is Aschenbrenner's "Situational Awareness": steady gains in compute, algorithms, and the unhobbling that turns a chatbot into an agent.
His sharpest point matches the data: the binding constraint becomes power, not chips. That is the whole idea in one line: the money is upstream. An influential but contested view, not a forecast. Read it ↗
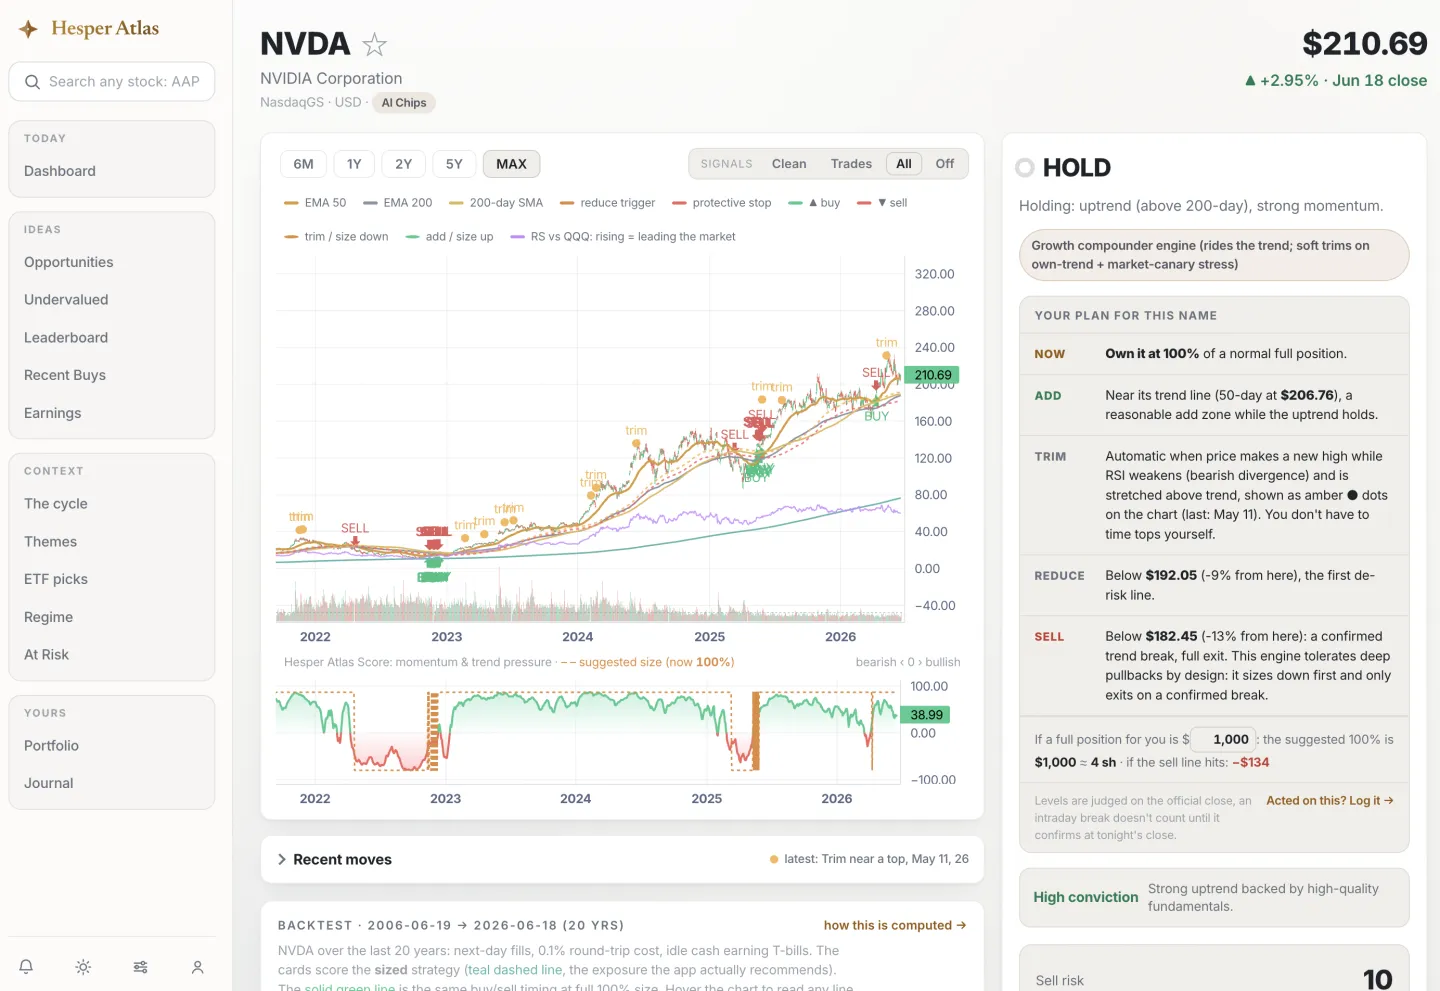
Exact trade plans
The price to buy at, add at, trim at, and the line where you get out.
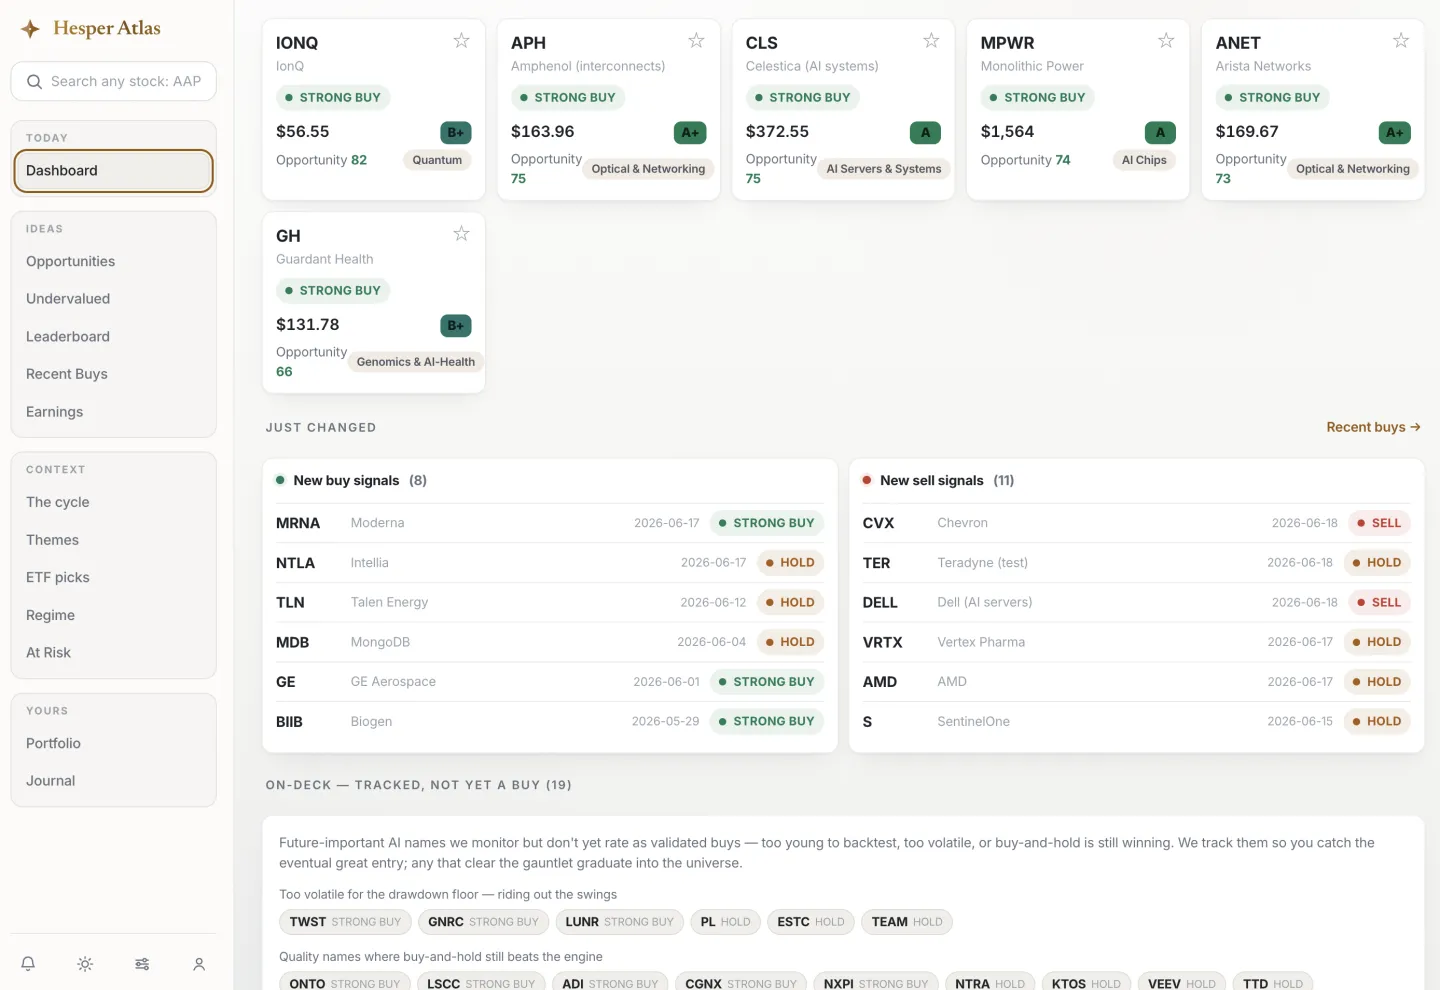
Daily alerts
Signal flips land on Telegram and in your inbox after each close.
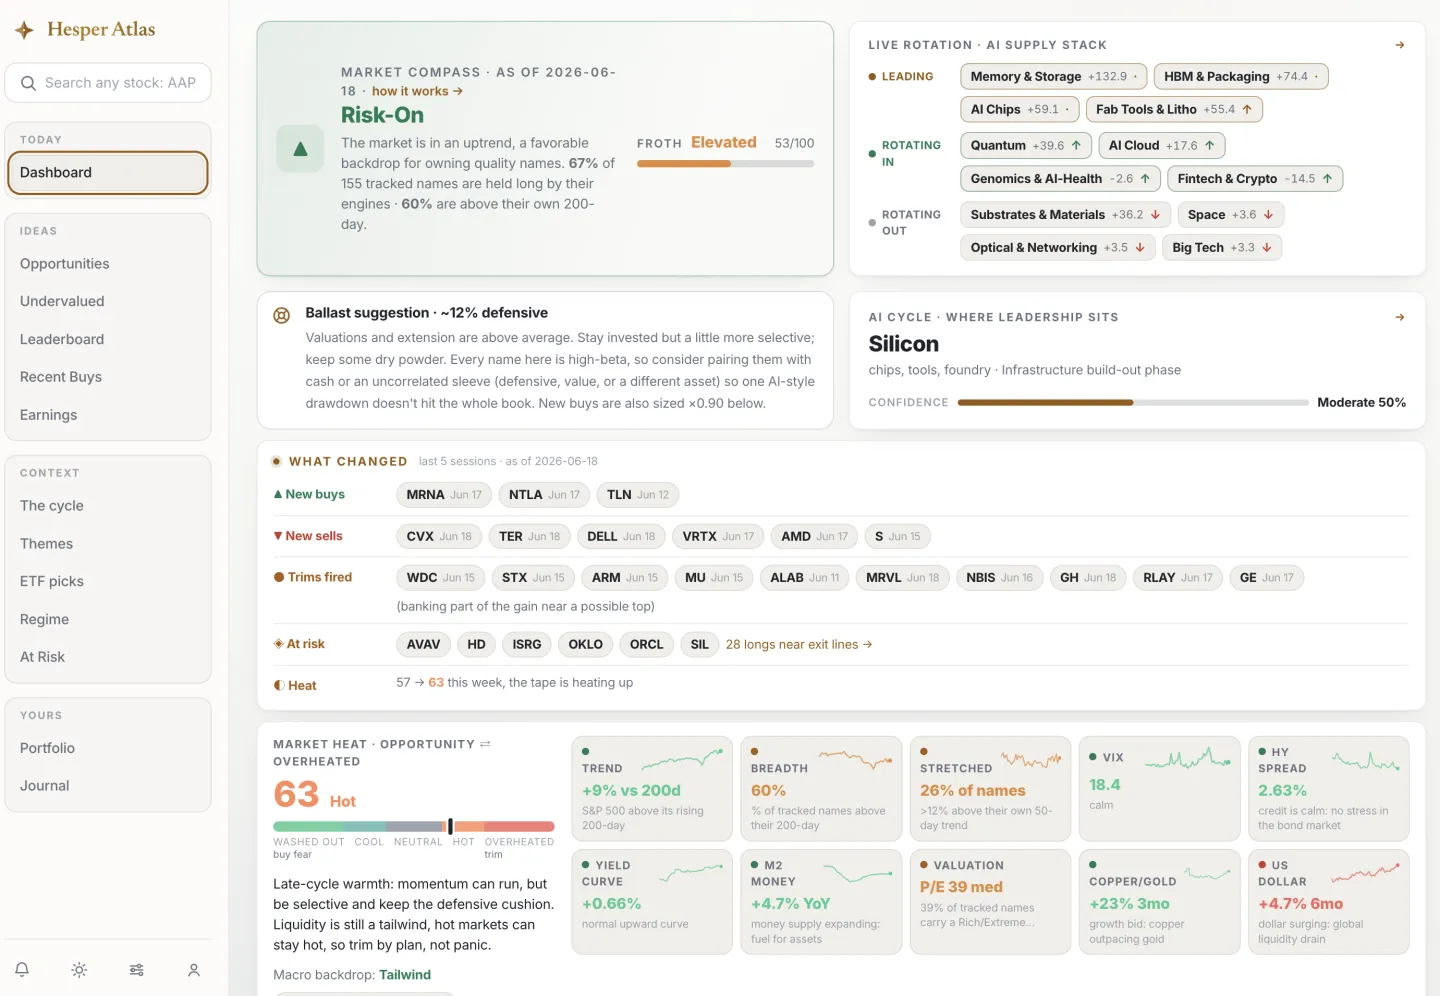
Market Heat gauge
One 0-100 read of the whole cycle, from opportunity to overheated.
Quality on sale
A running list of strong names trading at a discount, with the reason why.
Not a feed. A workbench you open every night.
Free: the dashboard, the heat gauge and three stock pages a day. Pro: every name, daily alerts, the at-risk monitor and the model portfolio.
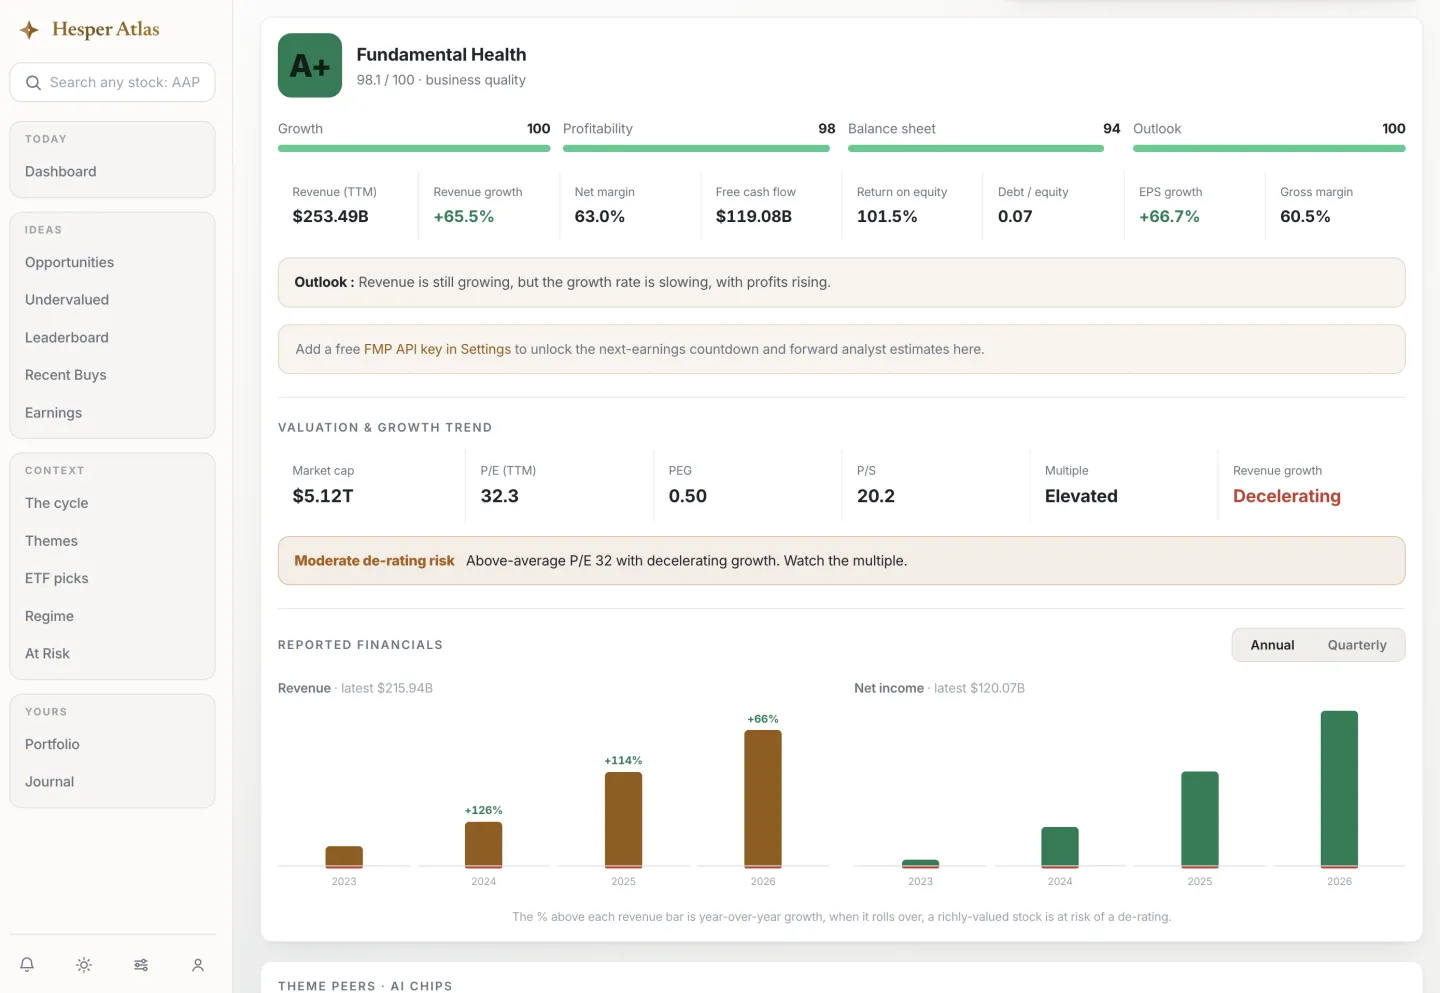
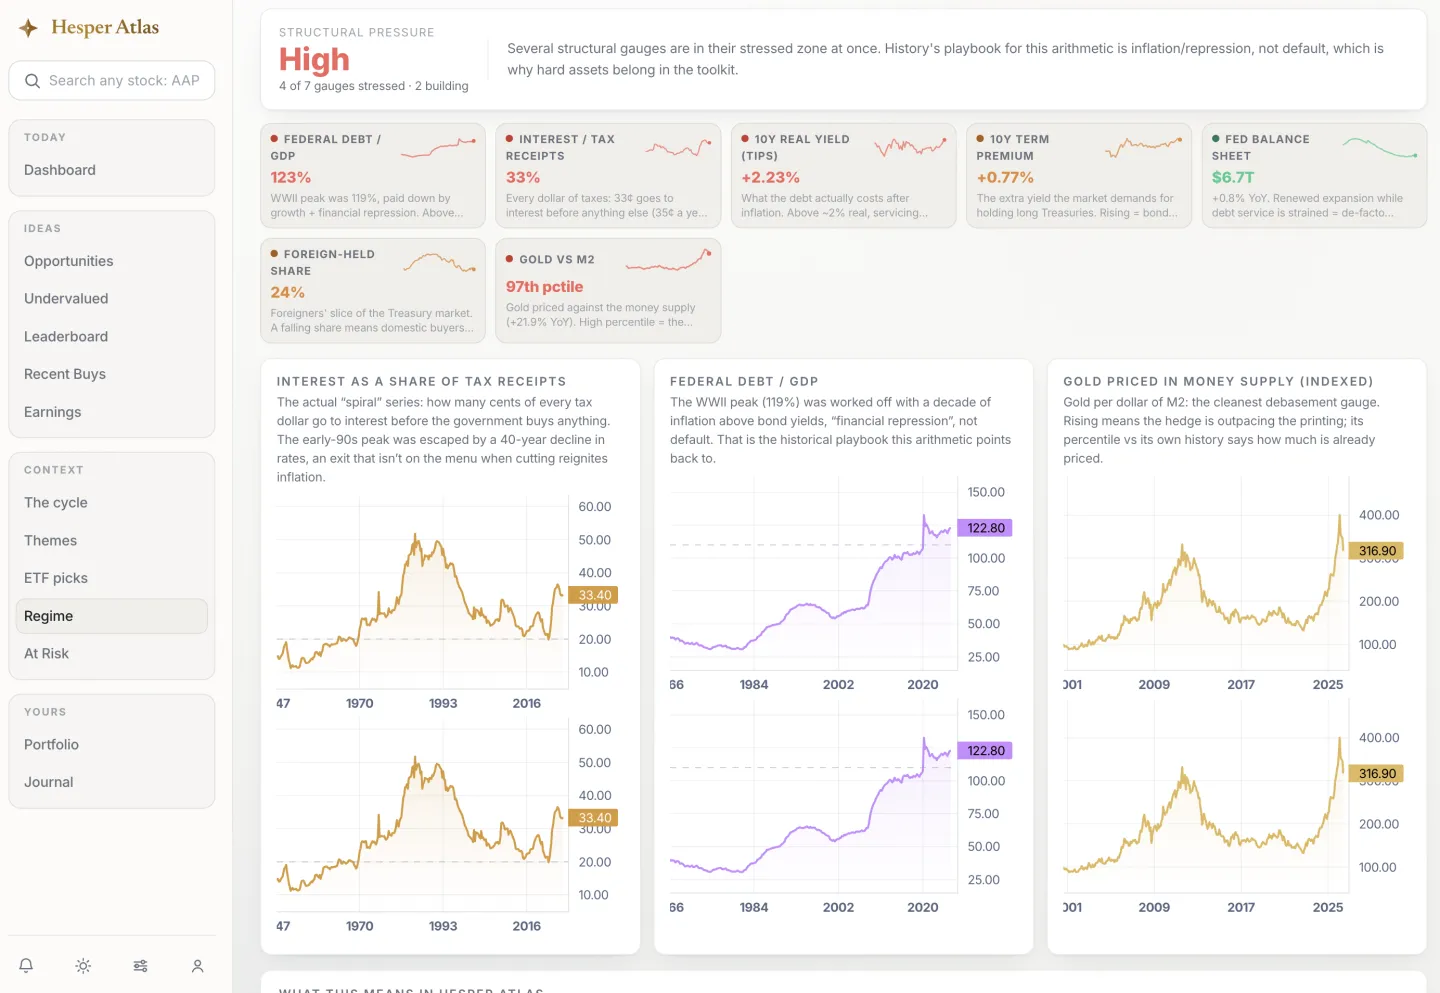
Every number on this page is a public JSON artifact, and an MCP server serves it to any AI agent, no account needed. Ask yours to verify the headline.
Start free. Upgrade when it earns it.
7-day refund, cancel anytime. The historical replay stays public either way.
Free
- ✓Market dashboard & Market Heat gauge
- ✓Macro tiles: M2, yield curve, credit spreads, VIX
- ✓3 stock pages per day, full trade plan included: exact buy / add / trim / sell prices
- ✓Nightly digest email: the market read and the night's signal changes
- ✓Public historical replay & methodology
- ✕Daily post-close alerts (Telegram + inbox)
- ✕Unlimited coverage of the full universe
- ✕The model portfolio & at-risk monitor
Pro
- ✓The model portfolio: 10 or 20 names, rebuilt monthly, with its published walk-forward record
- ✓Everything in Free, plus unlimited stock pages across the 150+ name universe, indexes, BTC and gold
- ✓Daily post-close alerts on Telegram and in your inbox
- ✓At-risk monitor & sell-risk scores for what you hold
- ✓Risk-weighted allocation for your own holdings
Prices in USD. Checkout handled by Stripe. We never see your card details. Cancel online in one click, anytime. One email per day at most, no upsell blasts.
Fair questions.
What does Hesper Atlas cover?
Why should I trust the signals?
What results has the engine produced?
How do the signals work?
Can I cancel anytime?
How much does Hesper Atlas cost?
Is this financial advice?
Can an AI agent or LLM access Hesper Atlas data?
See tonight's signals.
A minute to set up: the dashboard, the heat gauge and three full stock pages a day, trade plan included, free.
Start free